The Five Step intuitive market-driven process
for analyzing water risk exposure
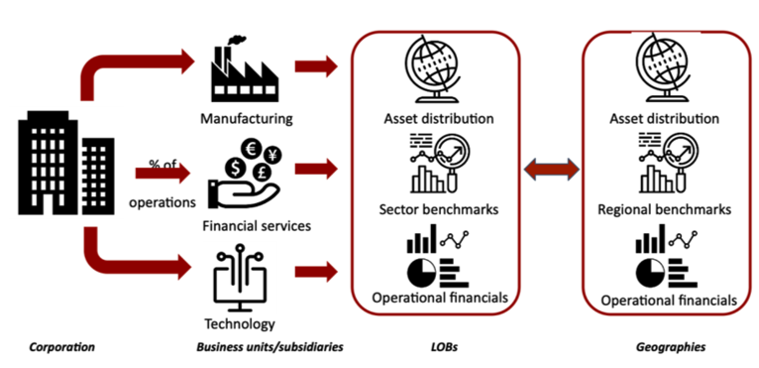
1 Aggregate corporate financial and water data
The Equarius Risk Analytics® process starts by quantifying the distribution of corporate lines of business in terms of overall revenue to select the benchmark indices that need to be used for waterBeta™ computation. Following corporate structure analysis, reliable and complete data retrieval using APIs of pricing information, corporate fundamentals and water use data disclosures, followed by data curation, is essential to allow for our learning engines to predict water productivity economics and relative tail risk behavior to the company’s benchmark.
2 Infer Water Productivity Economics
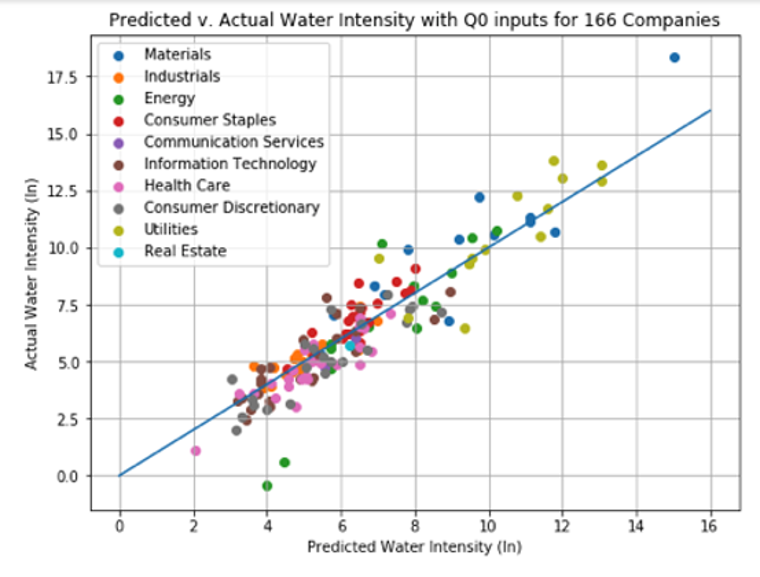
Equarius Risk Analytics® incorporates validated machine learning engines to predict water intensity by sales and by fixed assets from industry-specific financial metrics reported in corporate accounting statements. Our universe of financial metrics is based on a subset of factors in the Barra Model widely used by financial risk rating agencies, fund managers and investment banks. Using a five-factor model for water intensity by sales (WIpS) and a three- factor model for water intensity by net fixed assets (WIpPPE), our results are benchmarked against industry sector averages, weighted by market capitalization.
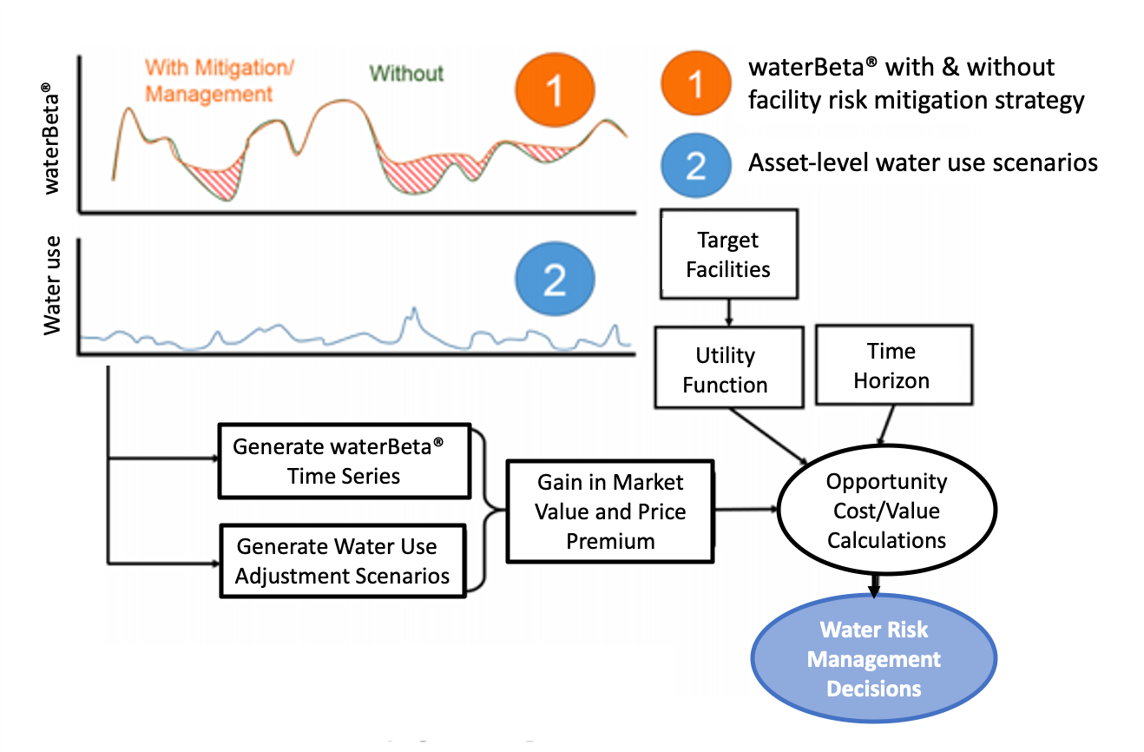
3 Calculate quarterly waterBeta™
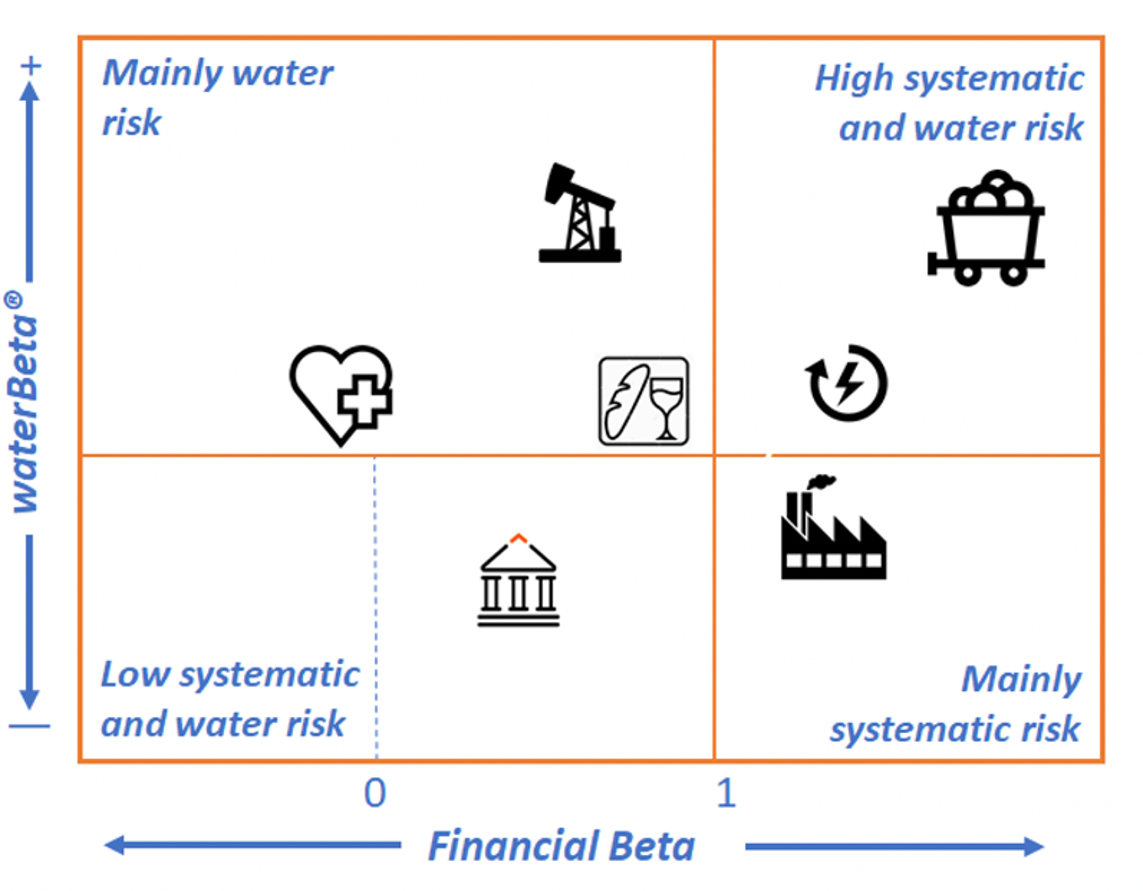
Equarius Risk Management® calculates waterBeta™ for each fiscal quarter with available and/or inferred data. The waterBeta™ values, average, and trends along with its components’ values, such as water intelligence quotient, provide insights into the corporation’s water risk exposure in the market and the impact of its water management strategies. waterBeta™ correlates excess tail price volatility of a company relative to its benchmark industry (or sub-industry) with facility-specific baseline water risk in the watershed (fractional asset risk), and asset-specific information on water use efficiencies to generate revenue (water productivity economics). waterBeta™ and its factors constitute a time-dependent, business line- and geographic asset-informed pricing signal of water risk exposures.
4 Quantify market premiums from water risk
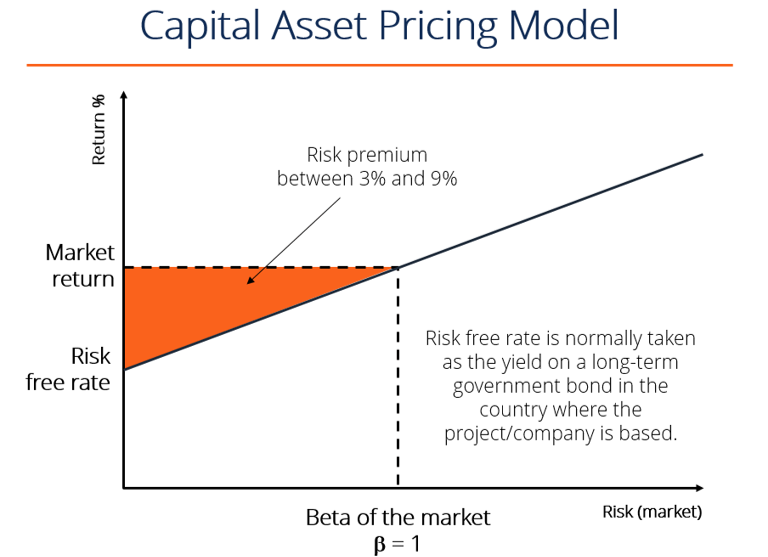
waterBeta™ factors such as waterIQ™ are used to quantify cost of equity (COE) and earnings per share (EPS) impacts from water risk exposures. The water risk premiums or discounts reflect valuations not captured in the market. The Capital Asset Pricing Model (CAPM) describes the (theoretical) relationship between systematic risk and expected return for equities. Our software uses the CAPM Build Up Model to adjust the COE for water risk using company-specific factors. In turn, the adjusted COE affects the EPS data, resulting in price and valuation adjustments resulting from corporate water risk management.
5 Empower corporate decision making
Equarius Risk Analytics® has developed an intuitive user interface to explore the impact of facility-level water risk reduction across the company’s lines of business and geographies using visualization and cost assessment tools. Ultimately, the risk manager wants to understand how actions taken within the company will impact market risk premiums and valuation. The waterBeta™ software allows for simulations of water risk management on corporate valuation, using facility prioritization and asset-specific process improvements using interactive visualization and cost impact tools. Equarius Risk Analytics® makes no recommendation as to solution selection and optimization. Index providers or fund managers can explore investment portfolios to understand embedded water risk profile of its constituents.